
Executive summary
- Bullish on the surface. On September 23, 2024, SPY closed at 569.67 — above both the 50-day (550.78) and the rising 200-day (519.24) moving average. By trend-following alone, an uptrend.
- Momentum was flashing warnings. The 14-day RSI showed a bearish divergence: SPY making higher highs while RSI made lower highs. Despite the price strength, internal momentum was weakening.
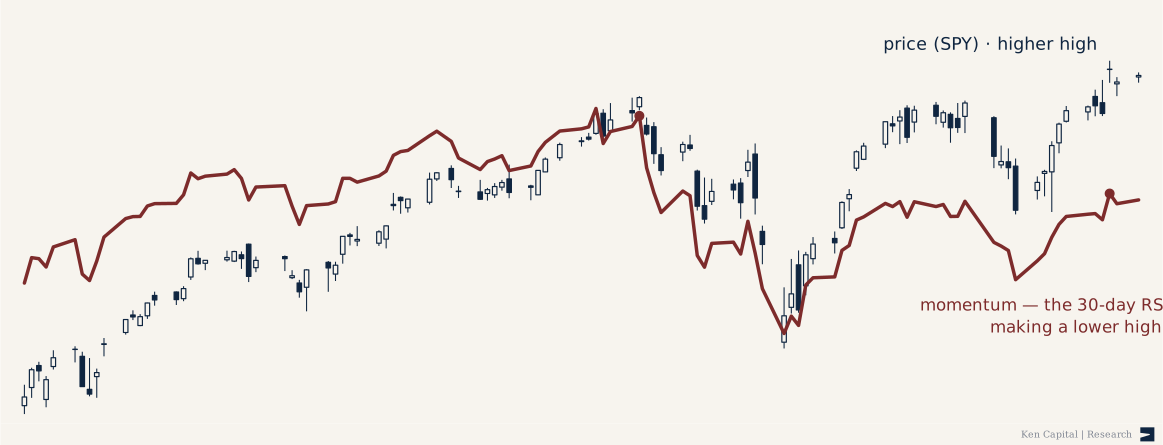
- The 30-day RSI confirmed it — the same divergence, more pronounced on the smoother line, and stronger evidence that a short-term pullback could be on the horizon.
- It survived a bull-market adjustment. Widening the RSI band to 20–80 to fit the environment, the negative divergence was still there — momentum still slowing.
- The call. With bullish momentum weakening under a rising price, a pullback toward the 50-day average or lower — and, underneath a tape making new highs, a footprint I read as distribution: weakening participation, not a claim about who was trading.
What technical analysis is
This is a piece of Technical analysisReading a market's own price and volume — supply and demand on the chart — to judge probable direction.Full definition →: it reads the chart itself — price and volume, the running record of supply and demand — rather than the company’s earnings or its balance sheet. The premise is that price already reflects what is known, and that the patterns crowds leave on a chart tend to repeat.
It is also the older art of the two. Price was being read long before fundamentals ever had the chance to arrive — Japanese rice merchants were charting markets in the 1700s, and Charles Dow was writing about trend around 1900, decades before Graham and Dodd codified fundamental valuation in the 1930s.
The setup
On September 23, 2024, SPY closed at 569.67 — above its Simple moving average (SMA)The average closing price over the last N days, redrawn each day — a smoothed trend line.Full definition → (550.78) and well above its Simple moving average (SMA)The average closing price over the last N days, redrawn each day — a smoothed trend line.Full definition → (519.24), with a window high of 572.88. By every trend-following measure, an uptrend: price over both averages, both averages rising. (The two lines are the same simple average over different windows — 50 days for the intermediate trend, 200 for the long-term one.)

- Close — 569.67.
- 50-day average — 550.78.
- 200-day average — 519.24.
- RSI (14) — 62.72.
- RSI (30) — 58.59.
- Source — SPY daily bars (.csv), Yahoo Finance (unadjusted close); RSI is Wilder’s.
What momentum was doing
Beneath the higher price, momentum was fading. Measured at the two price swing highs — mid-July and mid-September — price rose while both RSIs fell:
| At the price high | Jul 16, 2024 | Sep 19, 2024 |
|---|---|---|
| SPY close | 564.86 | 570.98 — higher high |
| 14-day RSI | 75.6 | 64.9 — lower high |
| 30-day RSI | 69.8 | 59.4 — lower high |
Price made a higher high while both RSIs made lower highs — a bearish divergence: a rising price line over a falling momentum line, the classic sign that an advance is being carried by fewer, weaker up-days than the one before it.
The read — the case I made
While SPY remained above its key moving averages, the momentum indicators were starting to show warning signs. The 14-day Relative Strength Index (RSI)A 0–100 momentum gauge of how one-sided recent gains have been.Full definition → revealed a Bearish divergencePrice makes a higher high while momentum makes a lower high — a fading advance.Full definition → — higher highs in price, lower highs in RSI — which told me that despite the price strength, momentum was weakening. The 30-day RSI highlighted that momentum loss more strongly, stronger evidence that a short-term pullback could be on the horizon.
I adjusted the RSI range to 20–80 to account for the bull-market environment. Even after that adjustment the negative divergence was still visible: momentum was still slowing. The implication was direct — with bullish momentum weakening under a rising price, a pullback toward the 50-day moving average, or potentially lower.
I checked the weekly chart as well, and the negative divergence on the 14-week RSI was still very visible there, reinforcing the signal. But the daily chart highlighted the immediate momentum shifts more clearly, which made it the better lens for short-term caution over the next twelve months.
And the read beneath the read: this is what I read as selling into strength. A tape printing new highs while momentum quietly rolls over is consistent with distribution — supply being met by fewer, weaker buyers. To be clear about the limits of the tool: price, RSI, and volume show participation weakening; they cannot identify who is buying or selling. So this is an interpretation — my read of the footprint — not a claim to have seen institutions step out. That was the argument.
What happened next
A momentum divergence is a signal about the quality of an advance, not a dated price target. In the event, SPY made further highs into early 2025 before the break came — with an outside shock. On April 2, 2025 the “Liberation Day” tariff announcement hit, and over April 3–4, 2025 the S&P 500 fell roughly 10% (−4.84% on the 3rd, then −5.97% on the 4th) — its worst two-day stretch since the March 2020 crash, with more than $6 trillion in market value erased — before a partial rollback of the tariffs sparked a historic single-day rebound. Well within the twelve-month window the September read was framed on, the market broke. The later decline was consistent with the fragility warning — but an exogenous shock is not proof of timing or causation. The divergence flagged a fragile advance; it did not predict the trigger, and the tariff catalyst is not evidence that the chart foresaw it.
That night at the CMT pitch
I made this case live at the CMT Association’s “Pitch the Pros” night — in a room of professionals, for their judgment. Everyone was calling bull. I was the only bear in the room. The argument was the one above: momentum was diverging from price, and beneath a tape making new highs, the internals looked like distribution — selling into strength, as I read the footprint.
The cycle behind it
Markets move in cycles, and the cycle is really one of crowd psychology. After a crash, people are cautious — they have been burned, so they stay out. The long-term institutional money behaves differently: it comes back in early and quietly, picking off strong companies at value prices while everyone else is still nursing losses. As those names work, others follow. Yet even well into a new bull market, most people stay skeptical — calling for the next bear, sure the rally is a trap. That is the wall of worry a young bull climbs.

The skeptics are usually early and wrong because history is lopsided: bull markets last far longer, and travel far further, than bears. A bear market is conventionally a decline of 20% or more from the peak, and even a deep one gives back only a fraction of the advance that came before it. It doesn’t take much to see it — look at where the Dow and the S&P sit today against a generation ago; the retracements, brutal as they feel in the moment, are dips on a line that runs up and to the right.
Underneath the psychology are the fundamentals, and they move with it: as the cycle turns up, economies recover, profits recover, and the boom feeds itself — especially when something genuinely new is driving it. Every great bull has had its disruption. The computer and Apple; the automobile; the airplane; consumer electronics; the semiconductor that rewired the world; the electric car. Each opened a frontier, and each powered a market. AI is the current one, and I suspect this bull runs for a while yet on it.
But — this is the whole point — that is exactly when to stay grounded. When the crowd stops climbing the wall of worry and starts believing there is no top, euphoria takes over and prices are driven to an extreme. The late-stage tell is always the same: companies rush to IPO to raise capital at rich valuations, and insiders sell their own equity into the frenzy — much of what happened toward the end of the dot-com era, and much of what has been happening again. The patterns are close to universal, because the psychology is.
The same shape, one top earlier
The same setup appears one major top before this one. Into the January 2022 peak, SPY made a higher high while the weekly RSI made a lower high — and the 2022 bear market followed.

- Higher high — into the January 3, 2022 all-time high, a weekly high of 479.98, above the November 2021 high of 473.54.
- Lower high — the 14-week RSI diverged; its peaks stepped down from about 71 in November to 64 by late December, and momentum had already rolled over (about 58) by the January price top.
- What followed — the 2022 bear market; SPY was roughly −24% below that high by mid-year.
- Source — SPY weekly bars (.csv), Yahoo Finance (unadjusted close); RSI is Wilder’s.
It is the same read, one top earlier — and it resolved the way these tend to. As price ground to higher highs into January 2022, the RSI made lower ones: the momentum under the advance — the buying that has to keep showing up to carry a market higher — was quietly draining away. Each new high was bought with a little less force than the last. On the surface it still looked strong; it was, after all, making new highs. But the steam behind it was vanishing, and the buyers stepping in up there, paying up for the highs, were the ones the 2022 bear would trap.
The same honesty applies here as everywhere in this note. A divergence is a statement about the fragility of an advance, not a timing signal: it flagged thinning momentum under a rising price; it did not name the day the top would print or how deep the fall would run. And two clean instances — September 2024 and January 2022 — are a shape worth respecting, not a track record. Hindsight flatters a couple of good examples, and I would rather show two honestly than dress a handful up as an edge. But the pattern keeps turning up at tops for a reason: it is what a crowd looks like when it is quietly running out of new buyers.
A word of warning
The lesson of September 2024 is not really about SPY. It is that a market can look strong on the surface and be deeply deceptive underneath — price printing new highs while the thing that drives it, momentum, quietly fails. Everyone in that room saw a bull market, and they were not wrong that it was rising. They were wrong that it was healthy. It was extremely deceptive, and it kept climbing for months before it broke.
I think that is exactly where the AI trade sits now. I believe it is a bubble — and the honest part of that view is that I do not know when it pops, and neither does anyone else. Bubbles run far longer than they should; this one may keep going for a while yet, and that is what makes it dangerous. Being right that something is a bubble tells you nothing about the timing of it.
So the warning is not “sell.” It is the discipline the divergence teaches: consensus bullishness is not evidence of strength, the most confident-looking part of a market is often the most fragile, and you read the internals, not the headline. September 2024 was the small, clean version of that lesson. The current one is far larger — and the same rule applies.
Method and caveats
This exhibit is generated from SPY’s daily closes by a script in the research engine (exhibits/spy_momentum_divergence.py), which recomputes the moving averages and Wilder RSI from the raw bars and asserts every figure the original study printed before it draws. The data ships above as a CSV; anything the script does, a reader can reproduce. RSI is Wilder’s method at 14 and 30 periods. A divergence is an observation about momentum, not identified causation — it speaks to the fragility of an advance, not to any specific later event.